Life in and around Headington & OX3 (mostly), and Oxford (occasionally)
"To every complex problem there is a simple solution, startling in its simplicity, piercing in its clarity, and hopelessly and completely wrong" - Gore Vidal.
Earlier this month I wrote about the sorry tale of Oxfordshire County Council’s commissioning of a ‘Headington Transport Strategy’ which was to be drawn up with no local involvement apart from the big employers and Oxford City Council. Not even local County or City Councillors knew about the project until it was well under way.
Plenty of people were upset about this when the news broke and they told the County so. County planning officers came to a meeting with the message “Don’t worry, we didn’t mean it”. And now three weeks later the County has announced a public consultation to run for a month.
Interestingly, the form of this consultation is open-ended: there is no document on which people’s views are sought. We are just asked to give our thoughts on transport problems and possible improvements. It does beg the question of what has happened to the Strategy the County’s consultants should by now – according to the original timetable – have more-or-less finished. If this re-think by the County is to be at all meaningful we must hope that work on the consultants’ report is on hold so they can take notice of the views and ideas of the local community which lives with Headington’s transport problems every day. If you use the online form rather than email you have up to 40,000 characters to express your views!
Here’s my weekly round-up of local news for 19 – 25 August.
The improvements to the Croft Road cycle path in Marston have been delayed because the company supplying two bridges has gone bust, according to a message on the Marston Cycle Path flood information message board.
The official announcement of the new Headington bus routes finally emerged on Monday. The services are being subsidised with £1.2m from the Department for Transport’s Local Sustainable Transport Fund (LSTF). I assume that’s £0.4m for each of the three years of the initial contracts. Peter Headicar of Oxford Brookes University sent me a considered appraisal.
The people who run Brambles own the business and the premises. They’re selling because they want to retire.
@SunderSandher, who runs the Londis store, has reminded everyone that the shop will soon be open 24hrs a day.
The Wood Farm neighbourhood policing team moved to a new base at the Churchill Hospital on Tuesday.
The planning application to build three houses on the car park next to the Crown & Thistle on Old Road has been approved.
The Prime Minister has a bad back. It is thought he was treated at the Nuffield on Monday.
The campaign by Cllr @laurencepbaxter to persuade Oxfordshire County Council to reinstate the right turn into Risinghurst from the A40 continued. He tells me that if the County Council can’t or won’t fund a crossing with safety improvements – preferably a crossing with lights – it would be difficult to justify re-opening the turn.
Ther are reports that Hill View Farm in Marston may be turned into a conference centre. A twitter account @SaveOxfordFarm has been set up but as yet hasn’t really got going.
My favourite Headington-related tweet of the week:
I try to cover news from the OX3 postcode in Headington and out as far as Barton, Sandhills and Risinghurst (see map). To feed into next week’s summary you can comment on this article, or tweet either with the hashtag #ox3 or @mentioning @TonyOX3.
I came across some interesting data the other day about levels of deprivation in England. It’s from the Societal Wellbeing Theme in the Dept of Communities & Local Government’s (DCLG’s) Open Data Communities database. The Deprivation Indices 2010 have just been released: they are based on 2008 data so they show the situation 5 years ago. I have not yet found where you can see the detailed definitions behind the indices.
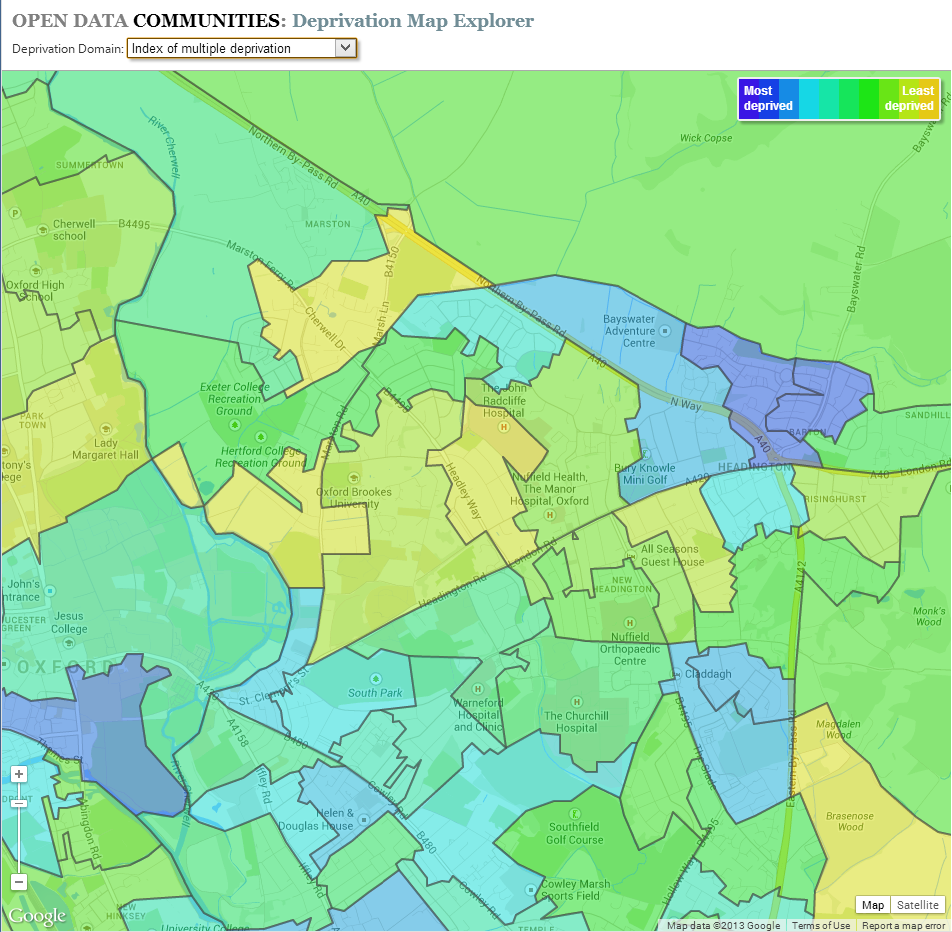
The data cover 32,482 areas in England. These maps show how each area is ranked. Clicking the thumbnails will get you a larger image, but to get the interactive maps where you can zoom in, pan, and see the results for any area you want, click here and enter a local postcode in the search box. To investigate the areas that make up OX3 I used OX3 9AH which is by the Headington traffic lights. This gets you to the Multiple Deprivation map. You get the other maps by using the drop-down menu box at the top left. Yellow areas are least deprived, dark blue most deprived. Click on an area to see its actual rank – the most deprived area has a rank of 1 and the least deprived a rank of 32482, so it’s better to live in an area with a high number than a low one.
Index of Multiple Deprivation
The Index of Multiple Deprivation combines 7 individual indices into one overall measure. The two areas covering Barton rank 4043 and 4096 out of 32482. Within the Headington/Marston/Barton area the least deprived part covers parts of New Marston and Northway and ranks 27552.
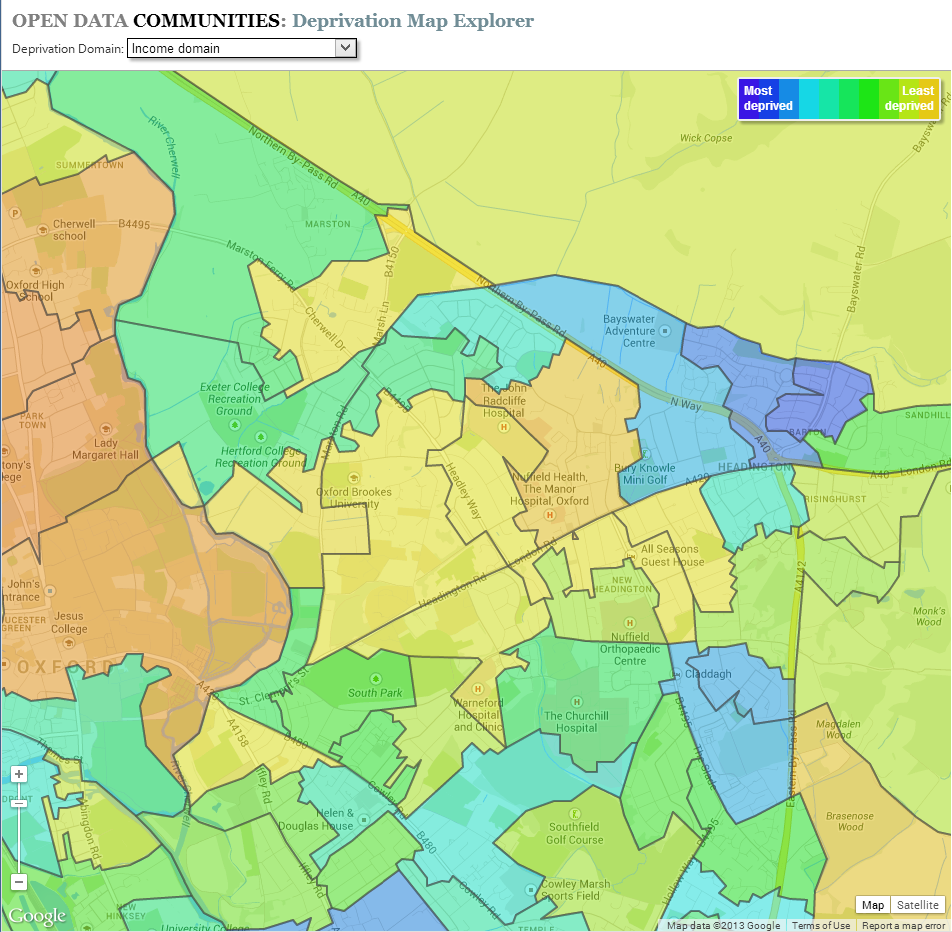
The Income data show a similar pattern. Barton ranks 3683 and 5097, while this time Jack Straw’s Lane is the least deprived, ranked at 28655.
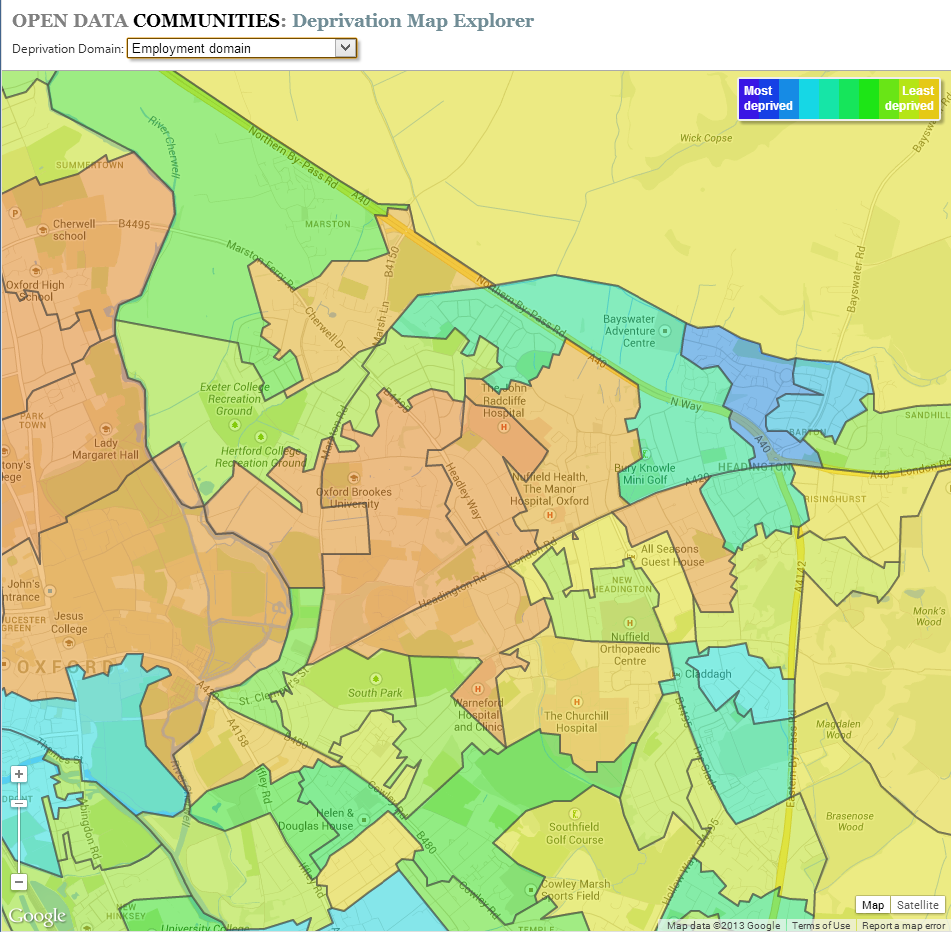
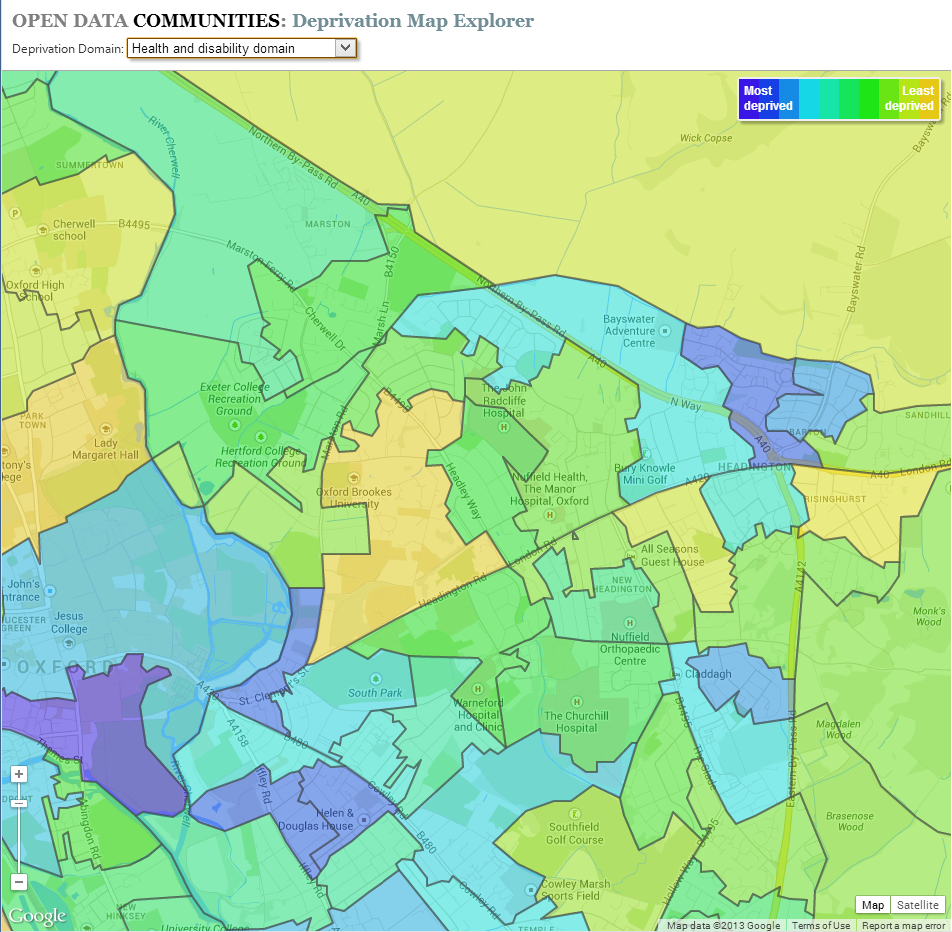
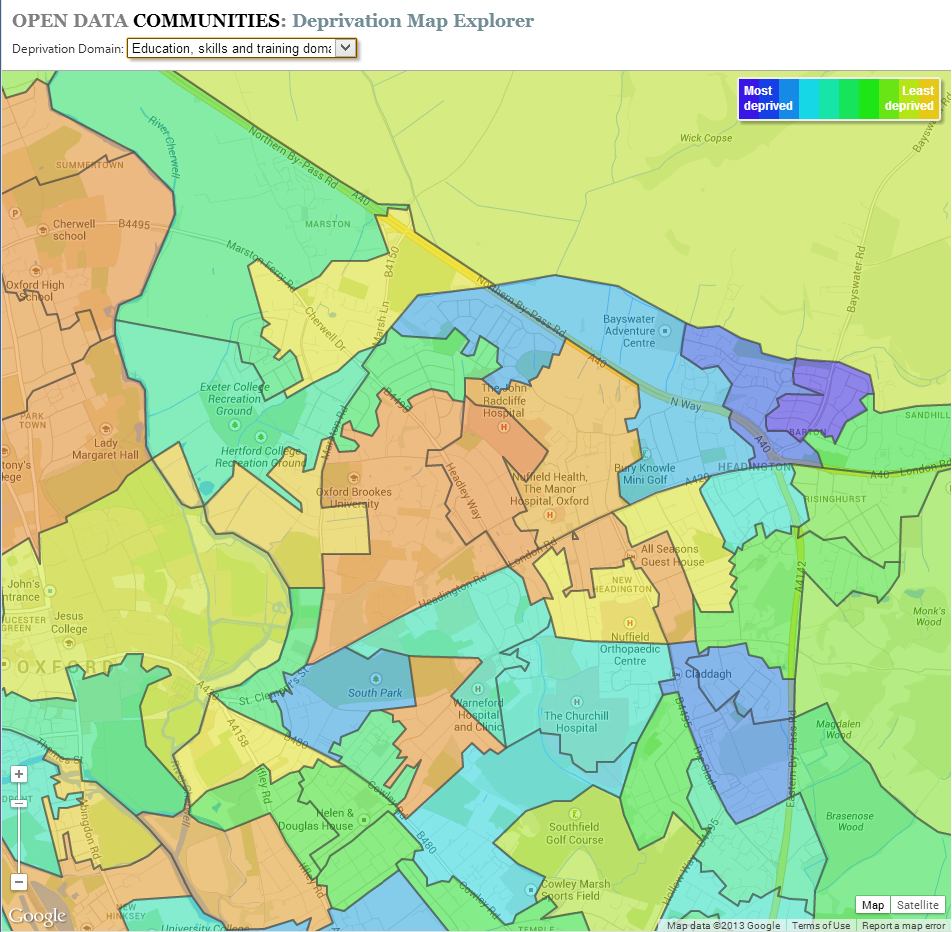
For Employment, Health & Disability, and Education Skills & Training, the picture is similar, with Barton standing out in blue against the yellows and greens of other parts of the local area.
Income
Employment
Health & Disability
Education, Skills & Training
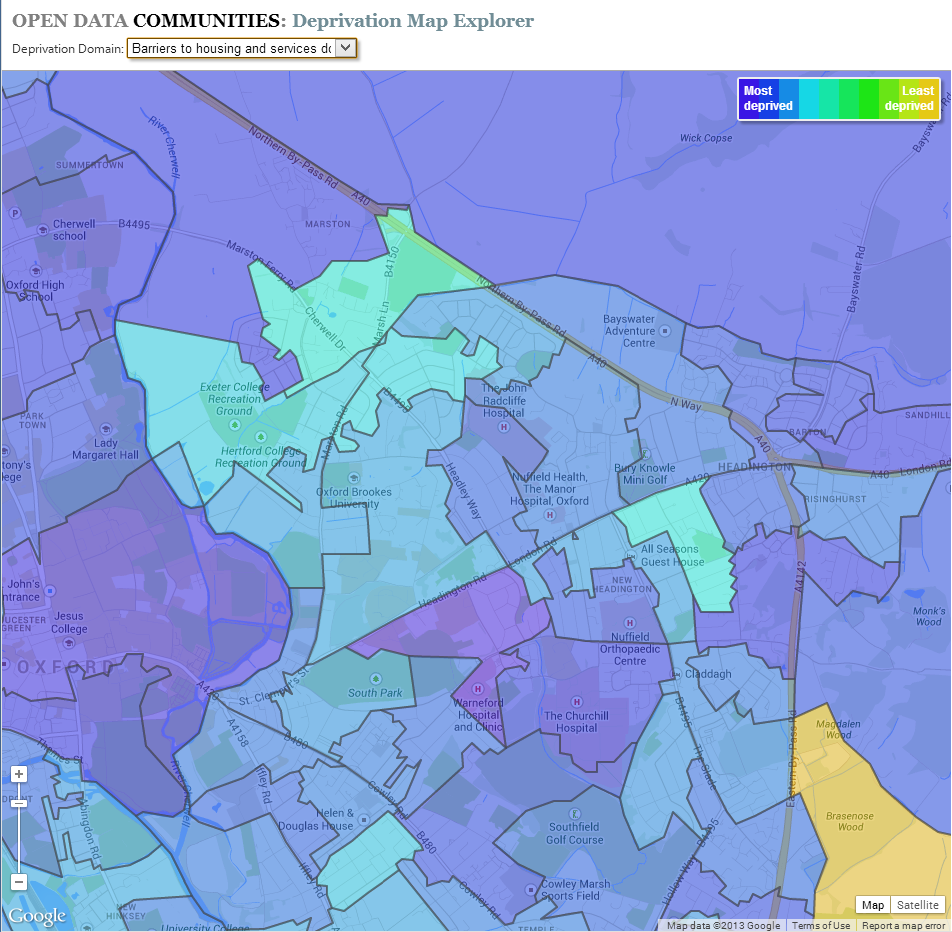
Barriers to Housing & Services
It won’t be a surprise that Housing (technically ‘Barriers to Housing & Services’) presents a very different picture. The whole of Oxford is blue or blue-green. Once again the New Marston and Northway area comes out best with a rank of 11169 while the area around Gipsy Lane and the Warneford Hospital ranks as the 108th most-deprived area in England.
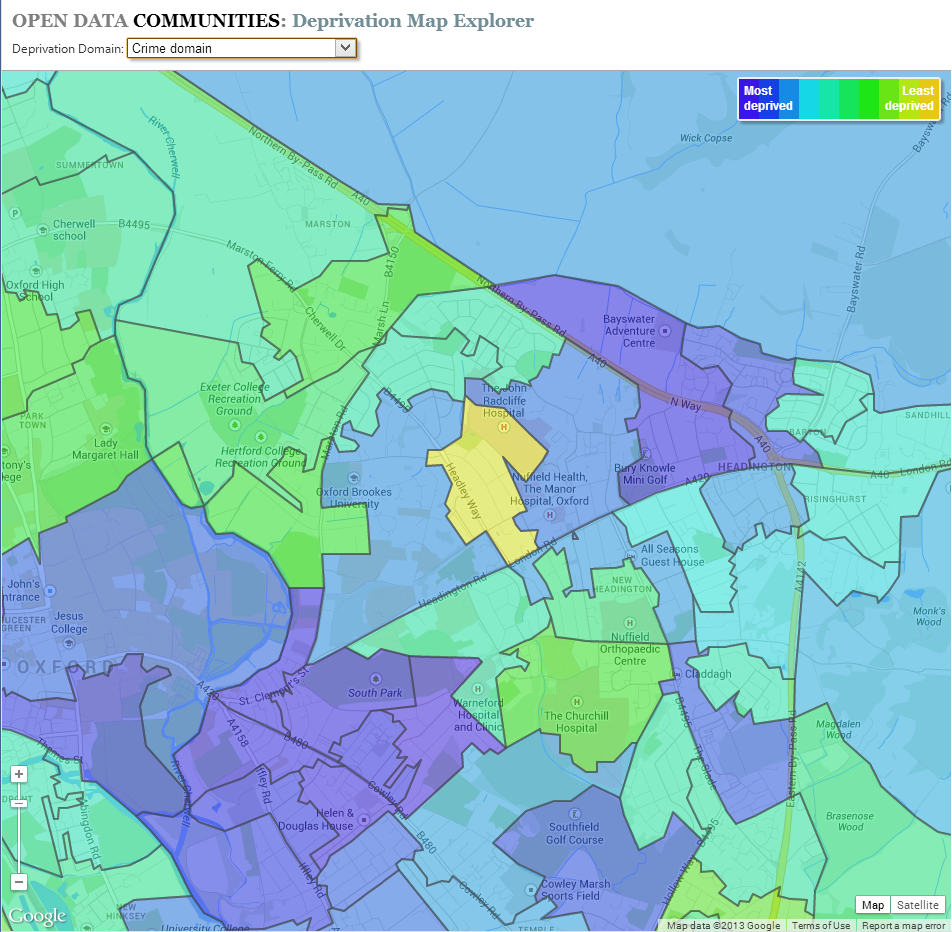
When it comes to Crime, OX3 comes off quite well compared to other parts of Oxford. The area north of the London Road around Barton Road, and over the A40 into the western parts of Barton is the most affected: it ranks 1275. The best local area on this measure is between Headley Way and the JR Hospital, ranking 27454.
Crime
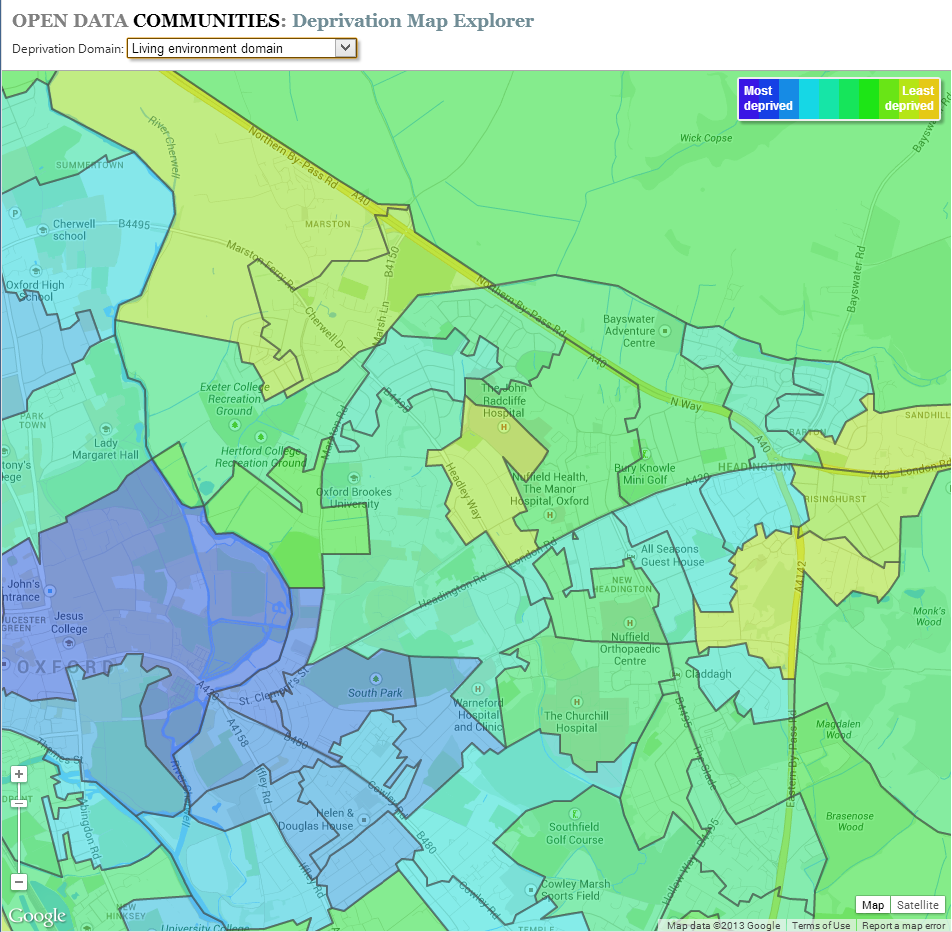
Living Environment
The last index, Living Environment, shows a better picture, with the most deprived areas in the centre of the city. The outer neighbourhoods of Sandhills, Risinghurst and Quarry rank in the low- to mid-25000s.
Although anyone might raise a quizzical eyebrow over some of the scores the individual areas are quite small and anomalous figures are probably just due to statistical variation. The maps do confirm what is already well-known, that on most measures there is a marked polarisation locally and in the City as a whole.