I came across some interesting data the other day about levels of deprivation in England. It’s from the Societal Wellbeing Theme in the Dept of Communities & Local Government’s (DCLG’s) Open Data Communities database. The Deprivation Indices 2010 have just been released: they are based on 2008 data so they show the situation 5 years ago. I have not yet found where you can see the detailed definitions behind the indices.
The data cover 32,482 areas in England. These maps show how each area is ranked. Clicking the thumbnails will get you a larger image, but to get the interactive maps where you can zoom in, pan, and see the results for any area you want, click here and enter a local postcode in the search box. To investigate the areas that make up OX3 I used OX3 9AH which is by the Headington traffic lights. This gets you to the Multiple Deprivation map. You get the other maps by using the drop-down menu box at the top left. Yellow areas are least deprived, dark blue most deprived. Click on an area to see its actual rank – the most deprived area has a rank of 1 and the least deprived a rank of 32482, so it’s better to live in an area with a high number than a low one.
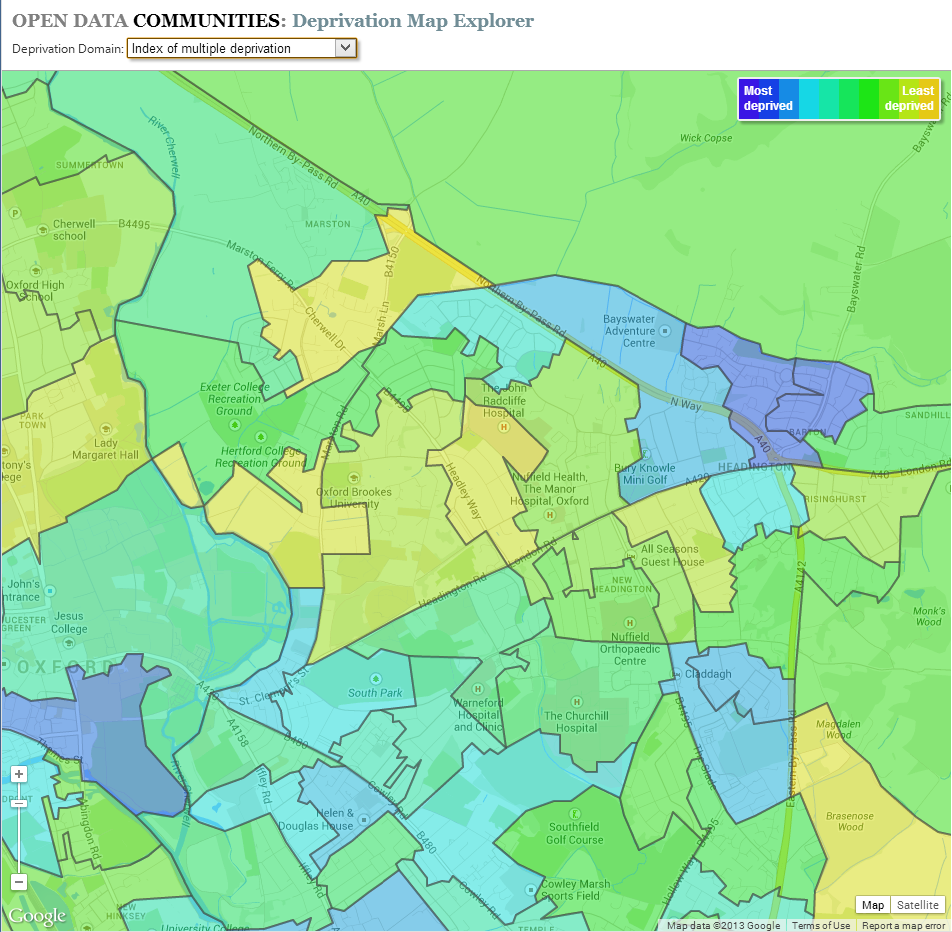
The Index of Multiple Deprivation combines 7 individual indices into one overall measure. The two areas covering Barton rank 4043 and 4096 out of 32482. Within the Headington/Marston/Barton area the least deprived part covers parts of New Marston and Northway and ranks 27552.
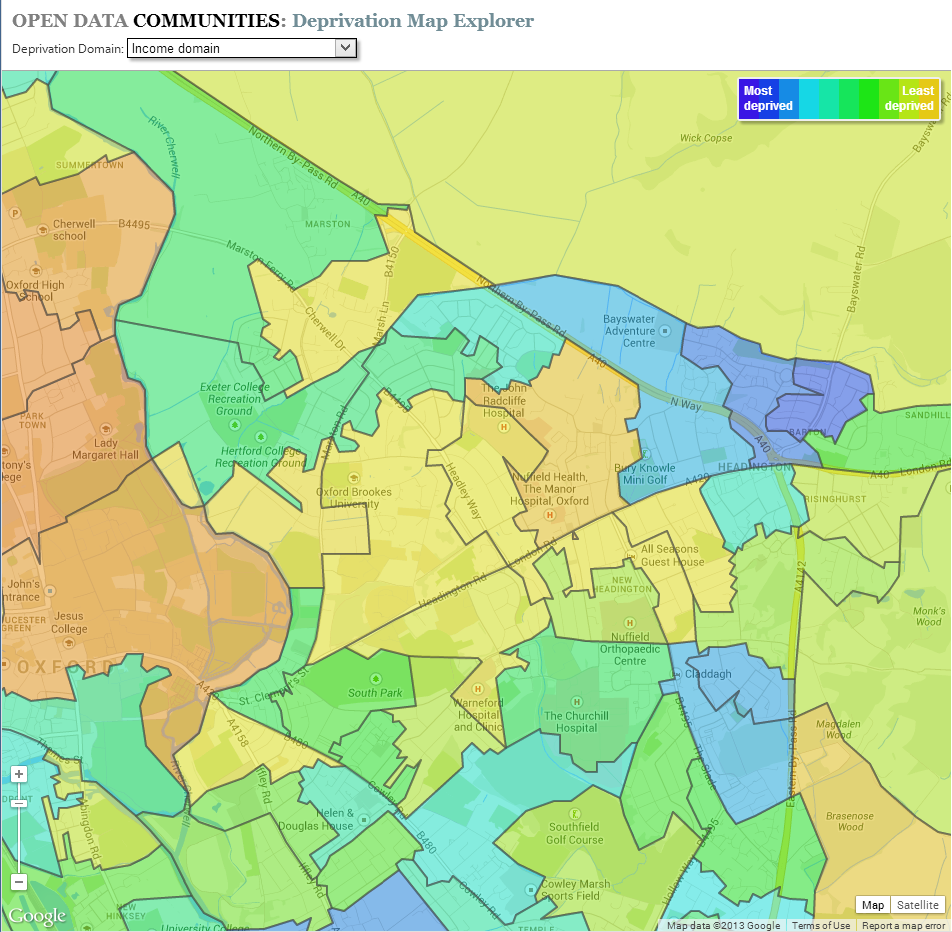
The Income data show a similar pattern. Barton ranks 3683 and 5097, while this time Jack Straw’s Lane is the least deprived, ranked at 28655.
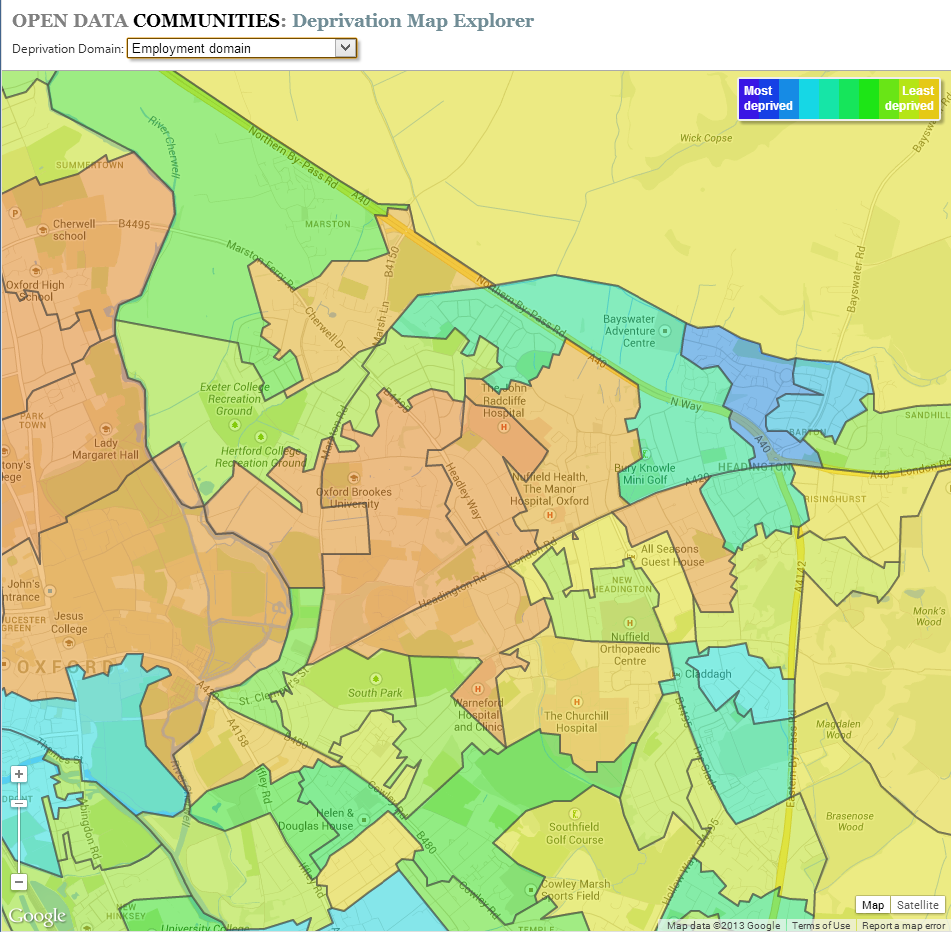
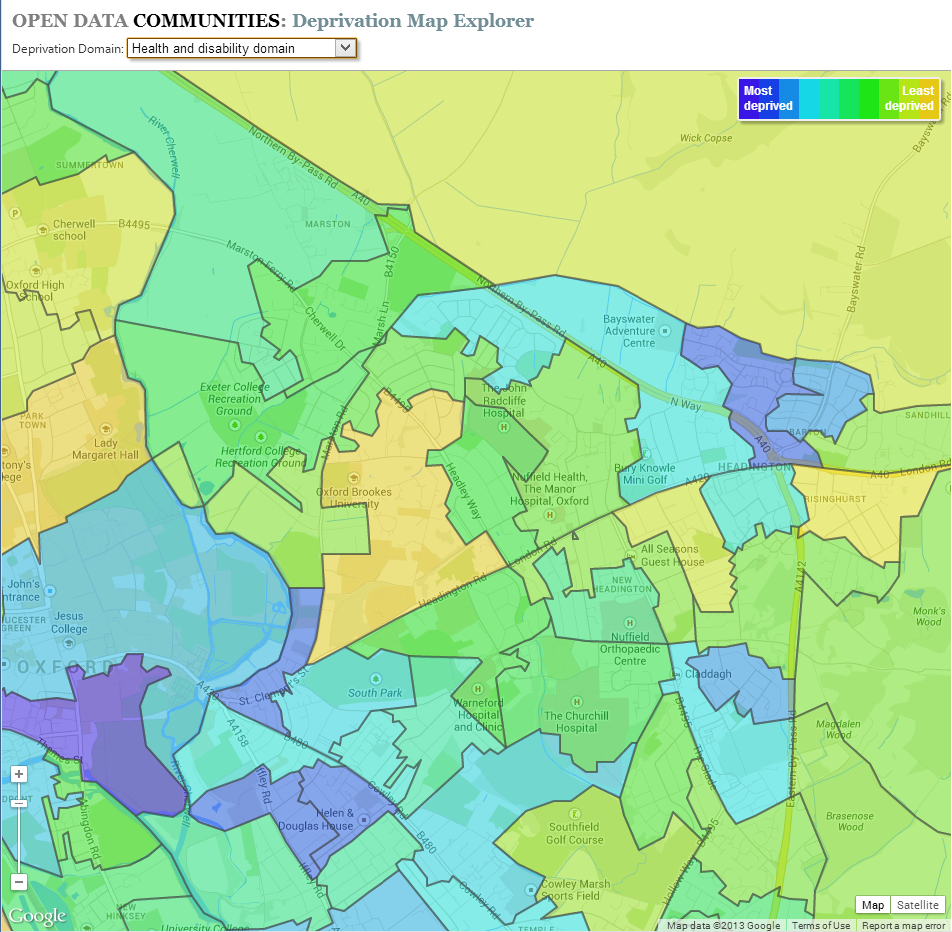
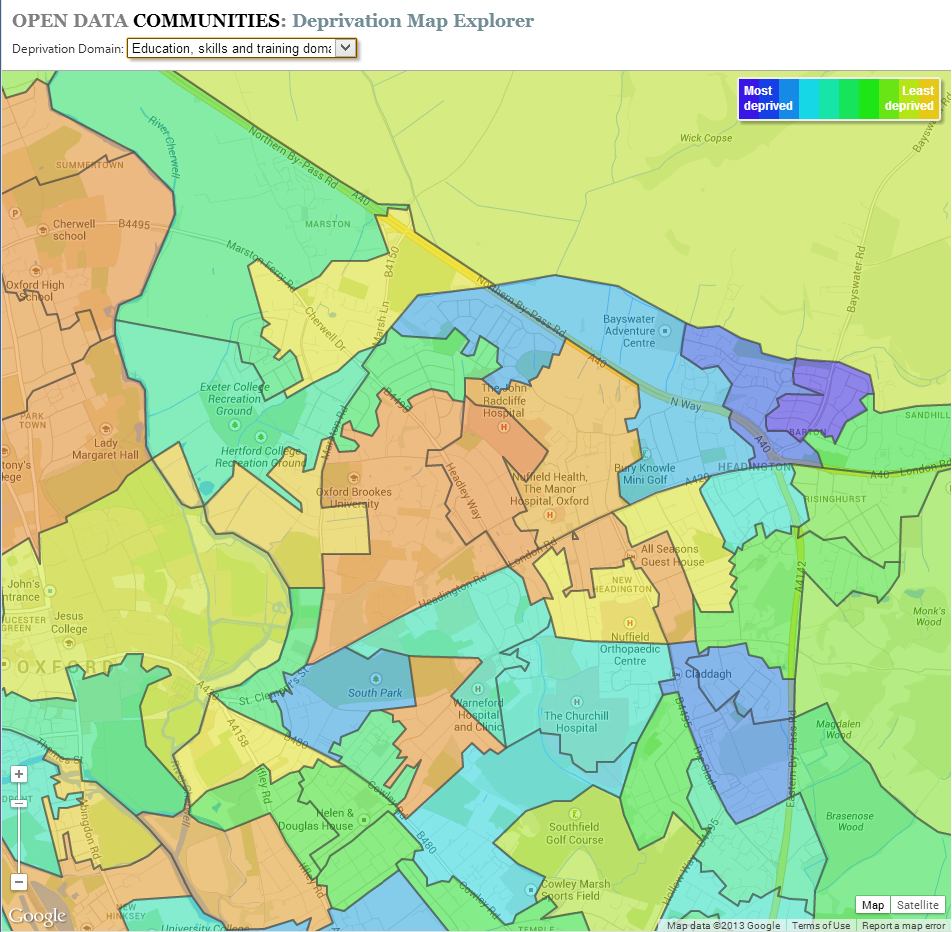
For Employment, Health & Disability, and Education Skills & Training, the picture is similar, with Barton standing out in blue against the yellows and greens of other parts of the local area.
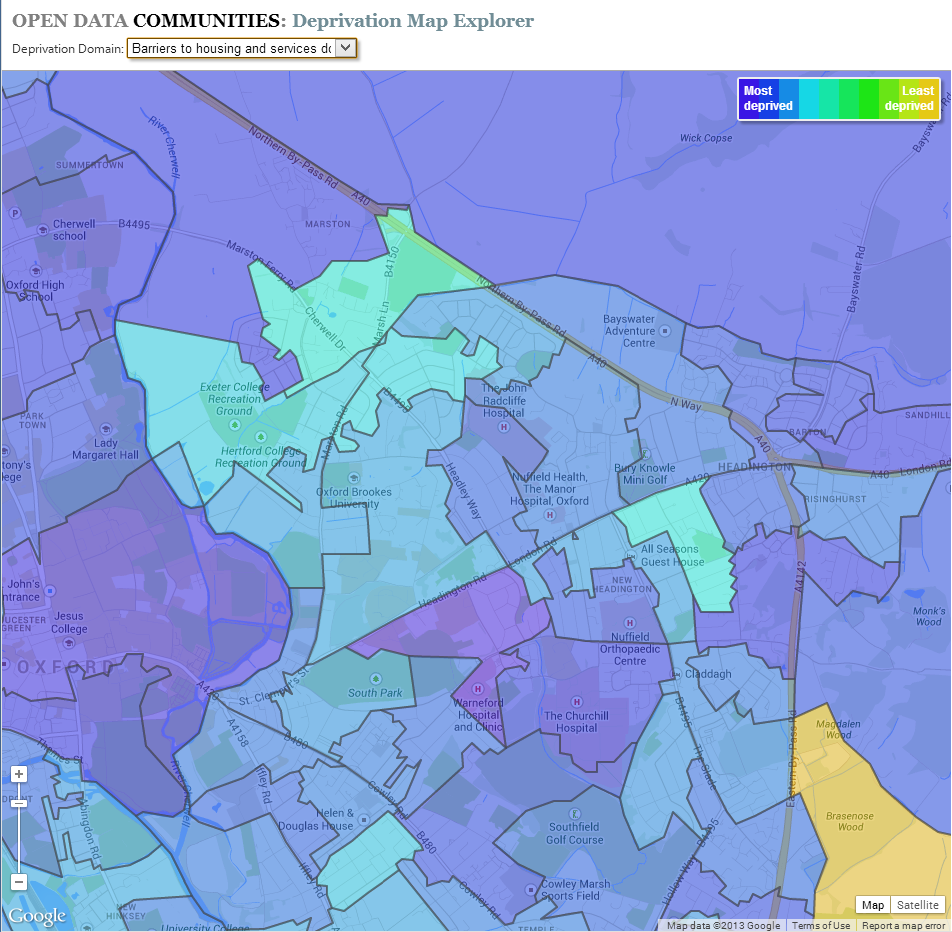
It won’t be a surprise that Housing (technically ‘Barriers to Housing & Services’) presents a very different picture. The whole of Oxford is blue or blue-green. Once again the New Marston and Northway area comes out best with a rank of 11169 while the area around Gipsy Lane and the Warneford Hospital ranks as the 108th most-deprived area in England.
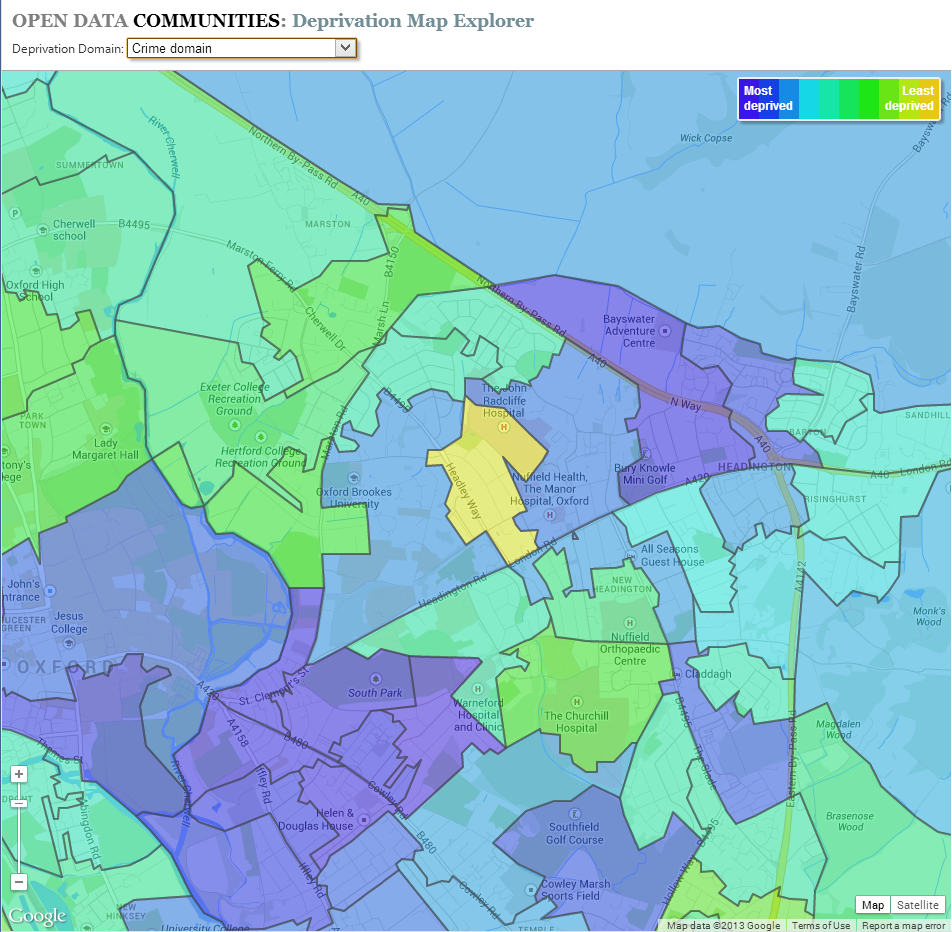
When it comes to Crime, OX3 comes off quite well compared to other parts of Oxford. The area north of the London Road around Barton Road, and over the A40 into the western parts of Barton is the most affected: it ranks 1275. The best local area on this measure is between Headley Way and the JR Hospital, ranking 27454.
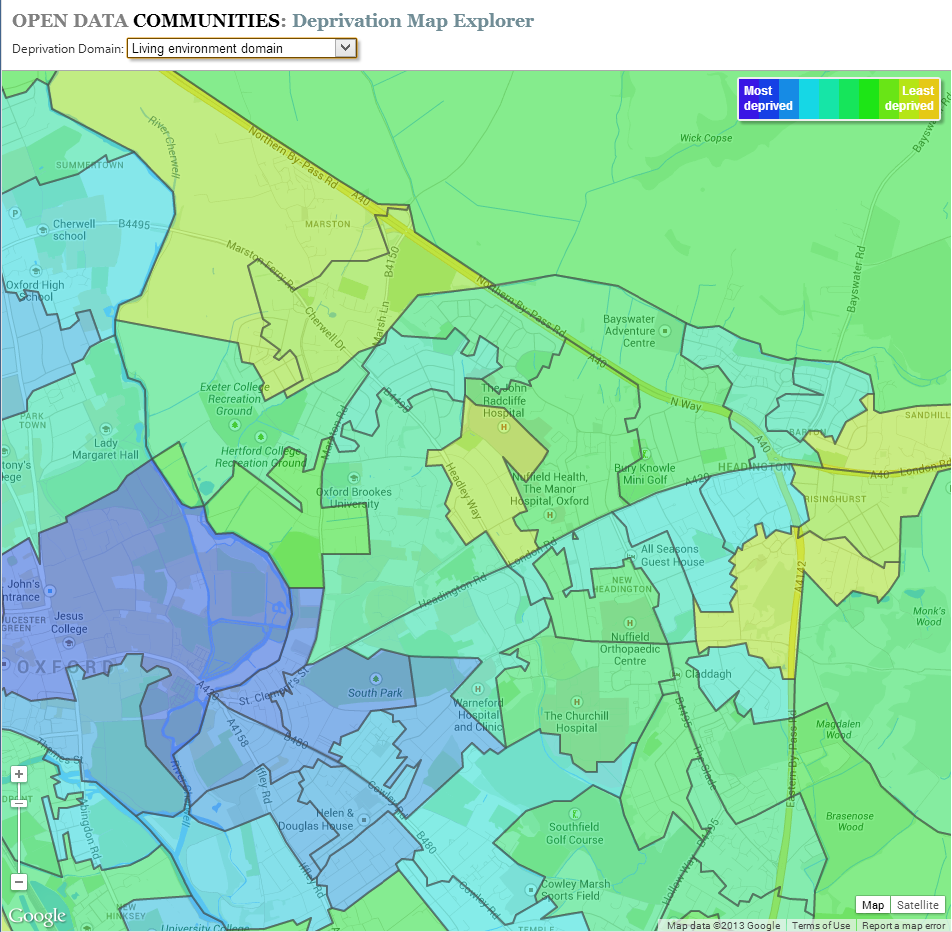
The last index, Living Environment, shows a better picture, with the most deprived areas in the centre of the city. The outer neighbourhoods of Sandhills, Risinghurst and Quarry rank in the low- to mid-25000s.
Although anyone might raise a quizzical eyebrow over some of the scores the individual areas are quite small and anomalous figures are probably just due to statistical variation. The maps do confirm what is already well-known, that on most measures there is a marked polarisation locally and in the City as a whole.